

Key Takeaways
- A CGM graph displays how your glucose levels change over time.
- CGM graphs help you identify trends, such as meal responses, overnight patterns, and the effects of stress or exercise.
- Try not to focus on single spikes. Instead, use your CGM data to spot patterns and make small adjustments that support long-term glucose stability.
{{mid-cta}}
If you’ve just started using a continuous glucose monitor (CGM), your first look at the graph might feel like staring at a foreign language. Lines zig and zag. Colors shift. Numbers change minute by minute.
Once you learn how to read it, though, that same graph becomes one of the most powerful tools for understanding your metabolism and making changes that actually work.
This guide walks you through:
- What your CGM graph is showing you
- Key metrics to track (including a few that matter more than you might think)
- How to spot patterns and turn them into action
The Basics of a CGM Graph
.webp)
Think of your CGM graph as your body’s 24/7 metabolic diary; it’s recording every rise, dip, and steady stretch in your glucose levels. The more you understand it, the more you can connect what you see on screen to what’s happening in your body.
Here’s what each part represents:
Y-axis (vertical)
Shows your glucose level. In the U.S., this is measured in mg/dL (milligrams per deciliter); in many other countries, you’ll see mmol/L (millimoles per liter). Most healthy, non-diabetic adults will spend the majority of their day between 70–140 mg/dL, but your personal range can vary.
X-axis (horizontal)
Marks the time of day. You can zoom in to see what’s happening minute-by-minute around a meal, or zoom out for a big-picture look at trends across a day, week, or longer.
The line
This is your glucose in motion, plotted continuously throughout the day. Every meal, snack, workout, and even your stress and sleep patterns influence its shape.
In the Signos app, the line is color-coded for quick interpretation:
- Blue is cool; your body might need energy.
- Purple is your optimal zone, keep it going!
- Yellow is heating up. It’s time to get in some movement.
- Pink is oversaturated. Your body is likely storing excess glucose as fat.
This visual coding makes it easier to spot patterns at a glance. For example:
- A steep yellow climb right after breakfast might indicate a carb-heavy meal with limited protein and fiber.
- A smooth purple plateau during sleep suggests good overnight stability (and often a solid LST score).
- A series of smaller hills throughout the day can indicate frequent snacking or grazing, each causing its own mini spike.
Once you get comfortable reading the axes and colors, your graph becomes less about “random lines” and more about cause and effect, showing exactly how your daily habits play out in real time.
Key Metrics to Understand
When you first open your CGM dashboard, the numbers can feel abstract. But each metric tells a different part of your metabolic story. Once you understand what they mean (and how to improve them), you can make targeted changes that actually move the needle.
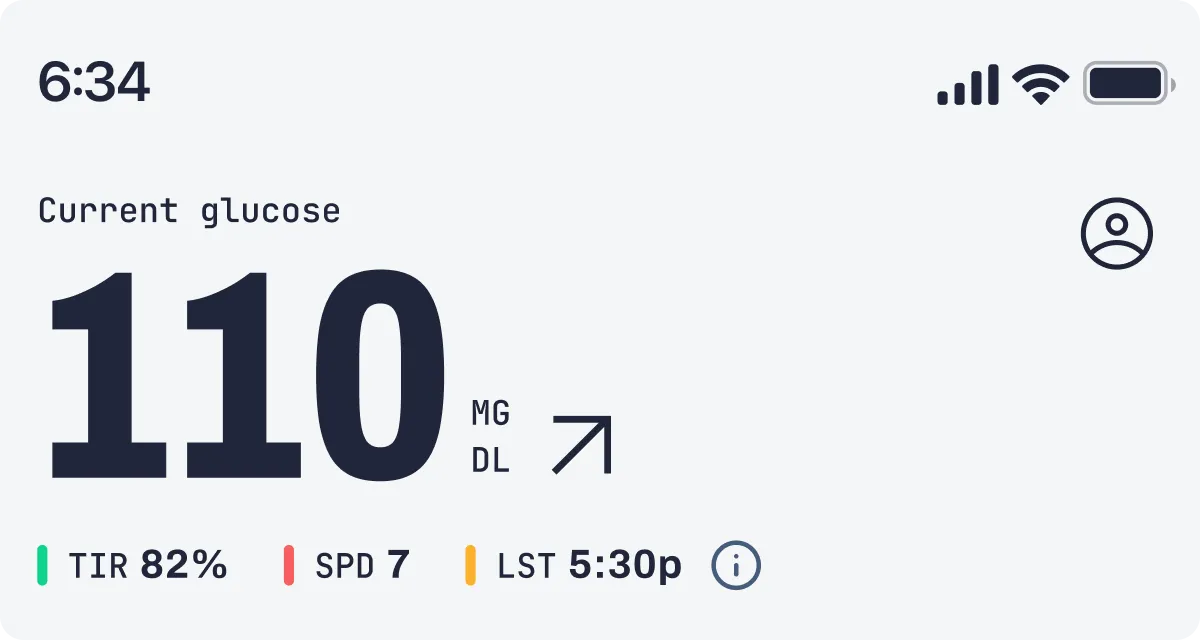
1. Time in Range (TIR)
What it is: The percentage of time your glucose stays within your target zone. For most people without diabetes, that’s 70–140 mg/dL, but your ideal range might be slightly different.1
Why it matters: The more time you spend in range, the less strain you put on your metabolism, and the lower your risk for long-term issues like insulin resistance, heart disease, and type 2 diabetes. Higher TIR is also linked to better daily energy and more stable moods.
How to improve TIR:
- Prioritize balanced meals (protein, fiber, and healthy fats) to avoid extreme spikes.
- Add light movement after high-carb meals to help bring glucose back into range faster.
- Keep an eye on weekly trends. Even a 5 to 10% improvement in TIR over time can have a big impact.
2. Glucose Variability (GV)
What it is: A measure of how much your glucose levels swing up and down throughout the day.
Why it matters: Lower GV means steadier energy, fewer cravings, and better overall metabolic control. High GV (lots of big spikes and dips) stresses the body and is linked to inflammation, poor recovery, and difficulty losing fat.2 In fact, GV is correlated with weight loss; the more stable your glucose, the easier it is for your body to shift into fat-burning mode.2
How to lower GV:
- Reduce spike amplitude by adding protein and fiber to carbs so the spike isn’t as high.
- Limit spike frequency by cutting down on constant grazing and high-glycemic snacks.
- Swap sugary drinks for water, sparkling water, or unsweetened tea/coffee.
3. Spikes Per Day (SPD)
What it is: How many times your glucose rises above your personal spike threshold in a 24-hour period.
Why it matters: Each spike pulls your body into a reactive state where insulin rises to pull glucose back down. The more often this happens, the less time your metabolism spends in a calm, fat-burning mode. A high amount of spikes per day can also drive more cravings, energy dips, and fat storage.
How to reduce this metric:
- Eat complete meals that keep you satisfied for 4 to 5 hours.
- Replace refined-carb snacks with higher-protein or higher-fiber options.
- Plan your workouts strategically; post-meal movement can help blunt spikes before they register.
4. Latest Spike Time (LST)
What it is: This metric tracks when your last significant glucose spike happens each day. Averaged over time, it highlights patterns in late-day spikes that can influence your overnight recovery and overall metabolic efficiency.
Why it matters: Evening spikes, especially after 6 pm, can make it harder for your body to stabilize glucose overnight, interfere with fat-burning, and affect morning energy. Signos members with earlier LSTs consistently see better weight-loss outcomes and steadier overnight glucose.
Tips to manage LST:
- Schedule your last meal a few hours before bedtime.
- Favor lower-glycemic foods in your evening meals.
- Add protein or healthy fats to evening carbs to slow digestion and prevent spikes.
- Keep late-night snacks minimal, and if needed, choose low-carb options.
Overnight Glucose and the Dawn Phenomenon
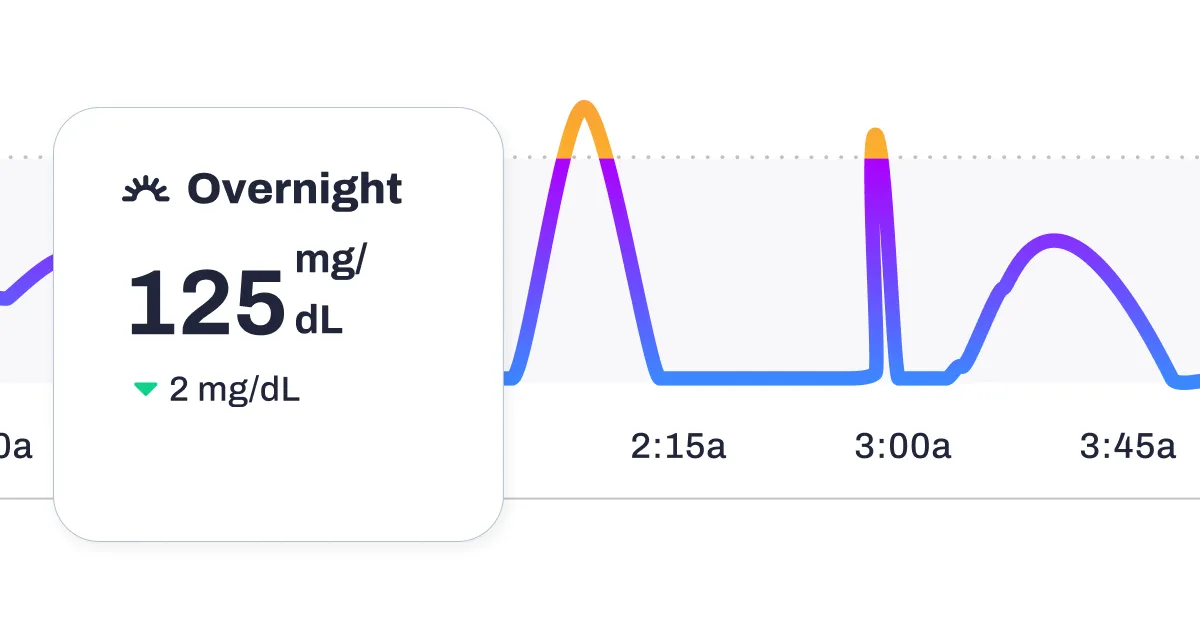
Your overnight CGM graph can be one of the most revealing parts of your data. Sleep is when your body should be at its most metabolically calm; ideally, your graph will look like a smooth, steady purple line, showing long stretches in your optimal zone.
When your glucose is stable overnight, your body can focus on recovery: repairing muscle, regulating hormones, and preparing you for the next day. But if you see big swings between bedtime and morning, your graph is telling you something about your late-evening habits or your stress load.
Why Overnight Glucose Might Be Unstable
Large rises or dips during sleep can be linked to:
- Late eating, especially carb-heavy meals close to bedtime, can be problematic. Your body is still processing food when it should be winding down.
- Alcohol before bed can cause an initial dip followed by a rebound spike as your liver processes the alcohol.
- High-carb dinners, especially without enough protein or fiber, to slow digestion.
- Stress or disrupted sleep; cortisol and adrenaline spikes can nudge glucose higher, even in the absence of food.
- Illness or inflammation; your immune response can raise glucose temporarily.
Small tweaks can often improve overnight stability:
- Shift dinner earlier, ideally 2 to 3 hours before bed.
- Choose lower-carb, higher-protein dinners if late eating is unavoidable.
- Limit alcohol in the evening.
- Add a short walk after dinner to help move glucose into your muscles before bedtime.
The Dawn Phenomenon
The dawn phenomenon is a natural early-morning rise in glucose, usually occurring between 3–8 a.m. It’s triggered by hormonal shifts (mainly growth hormone, cortisol, and catecholamines) that signal your body to release glucose from stored glycogen in preparation for waking up.3
For people living with type 2 diabetes, this rise is often more pronounced and can keep fasting glucose higher into the morning.3 Those without diabetes may see only a mild climb on their CGM graph before breakfast, while others may not experience it at all.3
What it looks like on your graph:
- A flat overnight line that starts to slope upward before you wake, even if you haven’t eaten.
- Colors shift from purple to yellow in the early hours without a clear food-related cause.
What to do about it:
- If your dawn rise is mild and short-lived, it’s likely nothing to worry about.
- If it’s steep or keeps you above your target range for hours, experiment with:
- Eating your last meal earlier.
- Reducing high-glycemic carbs at dinner.
- Managing stress in the evening to lower cortisol.
- Tracking LST to see if eating earlier in the evening reduces the rise.
Overnight glucose patterns aren’t just “sleep data;” they can reveal how your body is responding to your daily habits, stress, and recovery. A long, stable overnight stretch is a strong sign that your metabolism is in balance, while repeated instability gives you a starting point for fine-tuning your evening routine.
How to Spot Patterns and Take Action
.webp)
Your CGM isn’t just a tracker; it’s a feedback loop. Each spike, dip, or long steady line tells a story about how your choices, environment, and physiology interact. The more you connect those dots, the more effectively you can adjust.
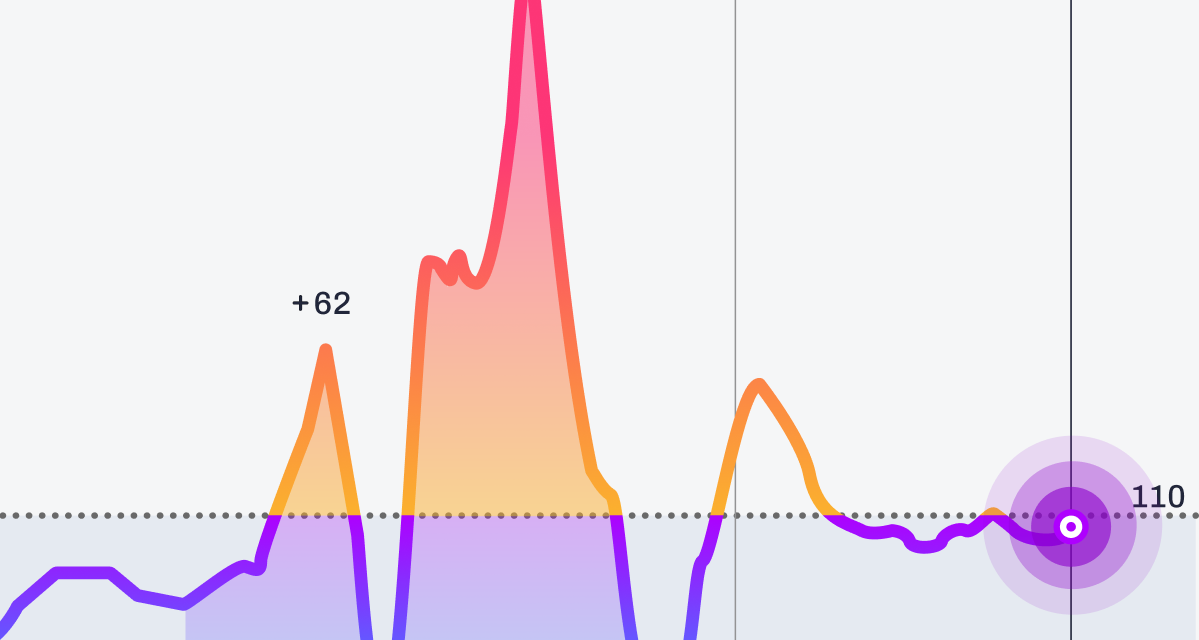
1. Post-Meal Spikes
What to look for:
After eating, especially carb-heavy foods like bread, rice, pasta, or fruit, it’s normal for glucose to rise. The key is paying attention to how high it goes and how long it stays elevated. Ideally, glucose returns to your pre-meal baseline within 2 to 3 hours.
If your CGM shows:
- A steep yellow or pink climb right after eating
- A prolonged plateau at higher-than-usual levels
- A rapid rise followed by a crash into blue territory (often bringing fatigue or cravings)
…it’s a sign the meal may need adjusting.
How to improve your post-meal response:
- Smaller portions of high-glycemic foods
- Add protein, fiber, or healthy fats to slow digestion
- Walk for 10–15 minutes after eating to help move glucose into your muscles
- Reorder your meal: vegetables and protein first, carbs last
- Experiment with swaps: try quinoa instead of white rice, or berries instead of tropical fruit
2. High Spikes Per Day (SPD)
What to look for:
The number of spikes per day you have is how many times your glucose rises above your personal spike threshold in a 24-hour period. A high number of SPD means your body is spending more time in a reactive, insulin-releasing state, and less time in a metabolically calm, fat-burning state.
You might see:
- Multiple yellow or pink peaks scattered throughout the day
- Small but frequent hills caused by constant grazing on snacks or drinks with sugar
- Spikes tied to habitual moments (morning coffee with added sugar, mid-afternoon snack, dessert after dinner)
How to lower SPD:
- Focus on balanced meals that keep you satisfied for 4 to 5 hours
- Cut down on quick-carb snacks between meals
- Replace sweetened drinks with water, sparkling water, or unsweetened tea/coffee
- Time movement after meals to blunt spikes before they register
3. Later Latest Spike Time (LST)
What to look for:
LST tracks the latest spike in your glucose levels each day and averages it over time. This reveals trends in late-day spikes, which can impact recovery, morning energy, and weight-loss efficiency.
Why it matters:
Signos data indicates that members with a latest spike before 6 pm tend to lose the most weight. A late spike can disrupt overnight stability, impair fat-burning, and reduce sleep quality.
To improve LST:
- Consider shifting dinner earlier or reducing your carbohydrate intake at night.
- Avoid late-night snacking on carb-heavy foods.
- Pair any evening carbs with protein or fat to blunt spikes.
4. High Glucose Variability (GV)
What to look for:
GV measures how much your glucose levels fluctuate throughout the day. High GV means larger peaks and valleys, while low GV means gentler curves and steadier energy.
Why it matters:
High GV isn’t just a long-term risk factor for heart and metabolic disease; it’s also tied to daily issues like fatigue, brain fog, mood swings, and cravings. GV is correlated with weight loss: the more stable your glucose, the easier it is for your metabolism to access stored fat.
How to lower GV:
- Pair carbs with protein and/or fat
- Avoid sugary drinks and refined carbs
- Keep portions balanced to prevent large spikes
- Limit spike frequency to reduce the number of swings per day
Pro tip: When reviewing your CGM data, don’t just note what happened; also record why you think it happened. Over time, patterns emerge: the same breakfast always spikes you, evening walks always improve LST, or stress at work raises your GV. This is how your CGM moves from “data” to “personalized action plan.”
Common Mistakes When Reading CGM Graphs
.webp)
Reading a CGM graph isn’t just about chasing the “perfect” line; it’s about understanding the bigger picture your data is telling you. Without the right context, it’s easy to misinterpret a spike or overlook patterns that matter most. Here are some common pitfalls to watch for so you can make the most of your insights.
Overreacting to Single Spikes
A spike right after a meal doesn’t automatically mean you “messed up.” Glucose will naturally rise after eating, especially if carbs are part of the meal. What matters most is how high that spike goes, how long it stays elevated, and whether this pattern repeats over time.
Instead of chasing perfection or aiming for zero spikes (which is neither realistic nor necessary), focus on keeping spikes shorter and less intense.
If you see one unusually high reading, ask: Was it a special meal? Did I sleep poorly? Was I stressed or sick? One data point is just that; one dot in a much bigger picture.
Ignoring Overall Trends
CGM insights really shine when you zoom out. Daily or weekly trends will tell you far more than an isolated moment.
- Are you consistently seeing a sharp yellow climb after breakfast?
- Are your afternoons filled with small pink peaks from snacking?
- Is your purple plateau at night breaking into yellow or pink after late-night eating?
These patterns help you identify which habits are worth adjusting. Use the Signos app’s weekly trend reports, or scroll through your past days to spot recurring rhythms in your glucose.
Forgetting Context
Glucose is influenced by more than just food. Physical activity, stress, poor sleep, illness, and even certain medications can alter your readings.
For example:
- A brisk walk after lunch may turn what could’ve been a steep yellow climb into a gentle purple slope.
- A stressful work meeting might cause a spike, even if you haven’t eaten recently.
- Fighting a cold or running on just a few hours of sleep can push your baseline higher.
Logging meals, workouts, and notes about your day in the app helps you connect cause and effect, so you can see whether a spike is from your plate or from life outside the kitchen.
The Bottom Line
.webp)
Once you understand your CGM graph (TIR, GV, SPD, and LST), you can stop guessing and start adjusting with confidence. Every data point is a chance to test, learn, and improve.
Your goal isn’t perfection. It’s fewer spikes, steadier lines, and longer stable stretches because that’s when your metabolism can do its best work.
Learn More With Signos’ Expert Advice
Curious how to take action based on your health data? Signos can help you make smarter food and lifestyle choices by connecting your daily habits with glucose insights. Learn more about glucose levels on the Signos blog.
Topics discussed in this article:

.svg)


.webp)


