
.png)
Have you ever eaten exactly the same breakfast you've had dozens of times, and your glucose barely moved? Then, the following week, that same meal produced a completely different response.
Glucose variability has many contributors: sleep, stress, hydration, activity level, and what else you've eaten that day. But if you menstruate, there's one more variable worth understanding.
Your menstrual cycle influences more than your period. Research suggests it can modestly shift glucose responses across the month, typically within a range of a few mg/dL (a shift smaller than what most people see after a piece of bread) in a pattern that tends to repeat cycle to cycle.
It can also influence insulin sensitivity, appetite, cravings, exercise performance, energy, and sleep in ways that may explain why some weeks feel metabolically different from others, even when nothing obvious has changed.
Your cycle isn't separate from your metabolic health. It's part of it. That's exactly why we built Cycle Tracking into Signos: a way to see your estimated cycle phase alongside your glucose data, log symptoms, and notice patterns over time, instead of treating every day as metabolically identical.
How Does the Menstrual Cycle Affect Blood Sugar?
Your cycle runs on two hormones that behave very differently where glucose is concerned: estrogen and progesterone.
Estrogen generally supports insulin sensitivity, meaning your cells respond efficiently to insulin's signal to clear glucose from your blood. Progesterone works against that: as it rises, insulin sensitivity tends to drop.
Here's what's actually driving that shift, and it's not only happening in your muscles and liver, where you'd expect it. Insulin also sends a signal directly to your brain, specifically to the hypothalamus, a region that helps direct how your entire body handles blood sugar. In a 2023 study in Nature Metabolism, researchers gave women a dose of insulin, delivered as a nasal spray so it reached the brain without raising insulin levels anywhere else in the body, during both the follicular and luteal phases of their cycle. During the follicular phase, that brain-level signal measurably improved how efficiently the rest of the body responded to insulin. During the luteal phase, the exact same signal did essentially nothing¹.
In other words, it isn't only that your ovaries are producing different hormones week to week. Your brain's own ability to help manage your blood sugar shifts too, on a cycle of its own. That's part of why the insulin response your body relies on in the first half of your cycle can go quiet in the second half, and it has nothing to do with your habits.
Here's what that looks like across a typical cycle:
- Menstrual phase: Both hormones are at their lowest. Energy often dips here too.
- Follicular phase: Estrogen begins climbing. This is generally when insulin sensitivity is at its best.
- Ovulation: Estrogen peaks, then falls sharply.
- Luteal phase: Progesterone rises and stays elevated. Insulin sensitivity typically declines, which is when many women notice glucose running a little higher than usual.
That said, no two cycles, or two women, look identical. Cycle length, hormone levels, and how sensitive someone's body is to these shifts all vary. This is a pattern to watch for, not a rule every body follows the same way.
How Blood Sugar, Hunger, and Energy Change Across Your Menstrual Cycle
This isn't just theory. In one of the largest real-world studies on the subject, 49 women wore a continuous glucose monitor, the same kind of real-time device you're already wearing, and tracked their hormones daily for several months. Their glucose didn't drift randomly from day to day. It rose and fell in a predictable rhythm tied to their cycle: lowest in the late follicular phase, then climbing to its highest point during the luteal phase, a pattern that held up even after accounting for differences in age, weight, and activity level².
The same study found something worth knowing on the days that matter most. The stronger a woman's food cravings were on a given day, the higher her glucose tended to run that same day, and this link showed up specifically during the luteal and ovulatory phases². In plain terms: the week you're fighting hardest against cravings may also be a week your glucose is already running a little higher on its own, which can make those cravings even harder to shake. The same study also found fatigue was more common during the menstrual phase itself².
So if this week feels different from last week, that's not a lack of discipline. It's physiology, doing exactly what it's built to do. The same meal really can produce a different glucose response depending on your phase. The extra hunger and carb cravings aren't a willpower problem; they track a real hormonal shift. The workout that feels harder than it should isn't in your head.
Why Track Your Menstrual Cycle and Blood Sugar Together?
Once you know this, the question changes.
Instead of asking "why did my glucose spike today?" and running through the usual suspects (sleep, stress, what you ate), you can add one more variable to consider: "was I in my luteal phase?"
That reframe matters more than it sounds. A single spike, viewed on its own, looks like a mystery, or worse, like something you did wrong. The same spike, viewed next to your cycle phase, becomes a pattern: something that happens most months around the same point in your cycle, for a reason you can name.
Say your glucose has been running consistently higher for the past week, alongside more fatigue and stronger cravings than usual. Without cycle context, that might read as a random bad stretch. With it, you might notice you're seven days into your luteal phase, right where the research above would predict exactly this combination². That's the difference between an isolated, confusing event and a recognizable, explainable pattern.
How Signos Cycle Tracking Works
This is what Cycle Tracking is built to surface.
From a new Cycle tab, you'll see your estimated current phase, a 7-day calendar strip, and a full calendar view with 6 months of history and up to 12 months of predictions. Log period days directly from the tab, or sync automatically from Apple Health or Health Connect. Each phase card includes a "Learn more" link explaining what's typically happening hormonally, and what symptoms are common, so you're never staring at a label with no context. During the luteal phase, a countdown shows how many days remain until your predicted next period.
Symptom logging is built right in, so you can tag things like cravings, mood changes, or fatigue in the moment and see them lined up against both your cycle phase and your glucose graph.
If your cycle is irregular or unpredictable, Signos won't force a prediction that doesn't fit. You'll still see your logged data, phase by phase, without a forecast pretending to know something it can't. That matters especially for women managing PCOS or other hormone-related conditions, where cycles often don't follow a textbook rhythm, but the same glucose patterns are frequently still there to be found.
How Cycle Tracking and CGM Data Work Together
Your CGM answers one question: what's happening right now?
Cycle Tracking answers a different one: why might today look different from last Tuesday?
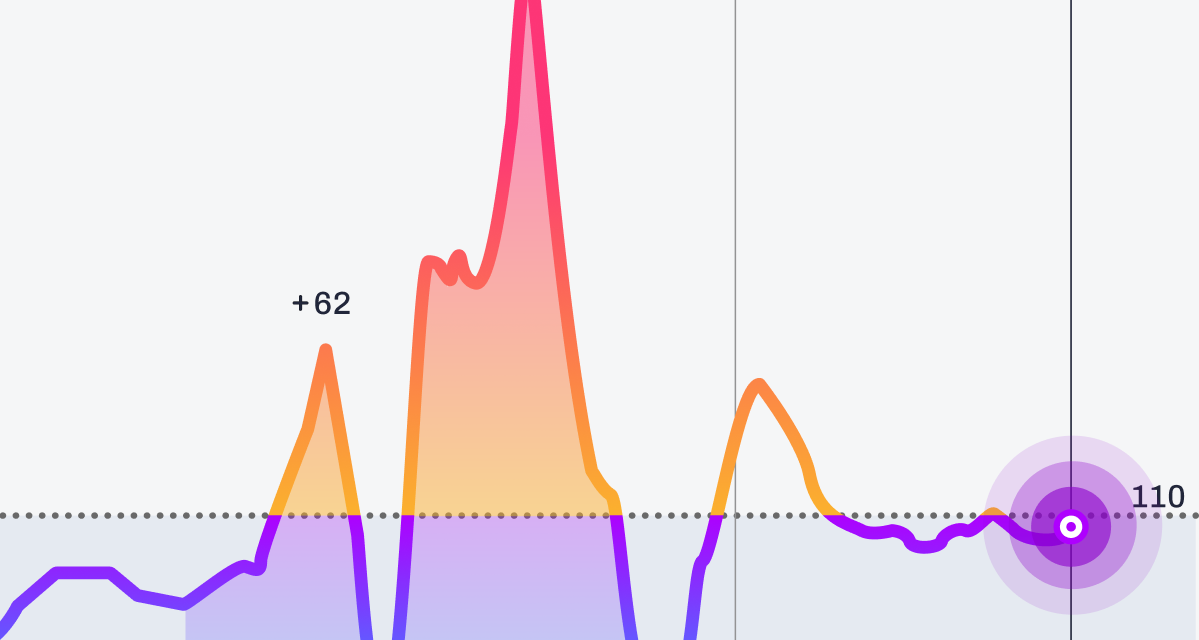
Neither tool replaces the other. Your glucose graph shows the moment-to-moment reality. Your cycle phase gives that reality context: a reason a normally flat response suddenly isn't, may have nothing to do with what you ate and everything to do with where you are in your month.
How to Track Blood Sugar Across Your Menstrual Cycle
- Log symptoms as they happen, not from memory later. A quick tag at the moment is more useful than trying to reconstruct how you felt three days ago.
- Watch for trends across cycles, not conclusions from one. One unusual month can be noisy. The same pattern repeating for two or three cycles is a signal worth paying attention to.
- Use the Learn More content when something surprises you. If your luteal-phase glucose looks different than you expected, that's exactly the moment to read the phase-specific education rather than guess.
- View your glucose graph in context, not isolation. Before assuming a spike means something went wrong, check what phase you're in. On the main homepage, under the glucose screen, your cycle phase is labeled so you know as soon as you open your app what phase you’re in.
- Let it inform your decisions, not control them. This is context for understanding your body, not a rulebook to follow rigidly every cycle.
What Cycle Tracking Can Teach You About Your Blood Sugar
Understanding your hormones doesn't mean you'll predict every glucose reading. It means you'll stop being confused by the ones that used to make no sense.
That's the real value here. Not certainty. Context. And once you have the context, the decisions that follow tend to get a lot easier.
Open your Cycle tab in Signos to see your estimated phase and start logging. And if you're new to Signos and curious what it looks like to finally see the connection between your hormones and your glucose, this is a good place to start.
Topics discussed in this article:
References
- Hummel, J., Benkendorff, C., Fritsche, L., et al. (2023). Brain insulin action on peripheral insulin sensitivity in women depends on menstrual cycle phase. Nature Metabolism, 5, 1475–1482. https://doi.org/10.1038/s42255-023-00869-w
- Lin, G., Siddiqui, R., Lin, Z., et al. (2023). Blood glucose variance measured by continuous glucose monitors across the menstrual cycle. npj Digital Medicine, 6, 140. https://doi.org/10.1038/s41746-023-00884-x

.svg)





.jpg)